Make The Best Use Of The Water Available To Irrigate Your Crop
Crop Intelligence Irrigation uses industry-leading technology to record, track and report natural rainfall and irrigation as they're used by your crops, boosting your confidence in water management decisions.
For more information or to purchase contact your local Crop Intelligence Vendor
Irrigation Log
The irrigation log will record, track and report irrigation events throughout the season, automatically organized by date, time and moisture volume. It accurately distinguishes irrigation from rainfall, helping you budget water costs.
Irrigation Deficit
The irrigation deficit is a value that shows how much irrigation is needed to achieve your yield goal. This value changes as rainfall occurs and irrigation is applied, indicating when irrigation is needed or not needed.
Budget Lines
The budget line helps determine when to apply irrigation based on root development. It is set to 50% of your soil profile's water holding capacity and you can customize based on your farming practices and local crop conditions.
Irrigation Potentials
Irrigation potential uncovers what next seasons Water Driven Yield Potential could be. By evaluating your crop type, field productivity and expected winter precipitation it allows you to plan irrigation needs to reach your goals next season.
Crop Intelligence Irrigation Insights Subscription Features Overview
- Set crop type and yield target by pivot
- View Irrigation Deficit - the estimated water needed for your soil zone and crop type to grow your yield target for that zone
- Irrigation Log - logging all irrigation events, can be exported in .xlsx file
- 10 Year Average Rain Displayed For Each Date
- Actual Rain Displayed for Each Date
- Available Water Displayed for Each Date
- Accumulated Current Rain Displayed for Each Date
- Accumulated 30 year Rain Displayed for Each Date
- 7 Day Weather Forecast For Stations GPS Position
- Temperature - Current & Historical Graph
- Daily High & Low Temperature
- Frost Event Log
- 24hr Rain - Current & Historical
- Accumulated Rain
- % of 30 Year Average Rain
- Rainfall Adjustment
- Wind Speed – Current & Historical
- Max or Gust Wind Speed - Hardware Dependant
- Humidity - Current & Historical
- Accumulated GDD (Growing Degree Days) - You Select Base Temperature
- Soil Temperature (if equipped) - Current & Historical Graph
- Solar Radiation (if equipped) - Current & Historical Graph
- VCC & Charge (Station Health)
- Export environmental data in .xlsx
- Hourly Soil Moisture Readings
- Soil Moisture Graph Displays Readings From 10cm, 20cm, 30cm, 50cm, 70cm, 100cm
- Display moisture by date range
- Field Capacity displayed for your specific soil texture
- Permanent Wilting Point displayed for your specific soil texture
- Quick look soil moisture profile bar
- Root Growth indicator icons
- Daily Soil Moisture Change By Depth Bar Graph
- Daily Total Soil Moisture Change Bar Graph
- Custom set your soil texture by soil moisture sensor
- Export soil moisture data in .xlsx file
Weekly Summary Reports
Automatically distributed to your app and email to have information on moisture change for the last 7 days, temperature and percipitation at your fingertips for in season decision making. An example report is below.

Year End Summary Reports
Automatically distributed to your app and email to summarize the growing season - putting the informaiton you need to help plan for next years crop right at your fingertips. An example report is below.

Agronomy Reports
A trusted Agronomist can be added to your account and complete in season scouting reports right from the app on their phone that are then displayed inside the application for you the customer to view. An example of the data from an in season scouting report displayed in the app is below.


Share environmental data with unlimited other users. Create your own network of local weather stations by sharing your weather information with others. You control your data and can choose who can see the information from your stations.
- Hardware Management
- Onboarding Zones
John Deere Operations Center API Connection - for more information visit our API connections site at: https://cropintel.ca/products/api-connections
- Receive email or push notifications to your phone for individual readings or a combination of readings.
- Build your own models to scout for certain crop conditions.
- Enable customized alerts for environmental weather factors: Air temperature, soil temperature, delta t, humidity, precipitation, wind speed, leaf wetness, water driven yield potential, available water and moisture level by sensor depth can all generate alerts.**
- Pre-set alerts toolbox alerts for rain, frost, soil temp, root activity, irrigation
** alerts available dependent on your station configuration
- Your trusted agronomic partner can create "In Season Visit" scouting reports right from the app by zone and share directly with you inside the app.
- Connect your trusted agronomist - Share your below ground and above ground data and insights with your trusted agronomist to allow them to easily help identify insights to drive the best use of your available water.
- Compare multiple zones in one account in one crop year
- Soil Information for onboarding each zone (slope / type / organic carbon / soil classification / region)
- Document Growth Stage
- Document fertility by zone
- Document soil test by zone
- Document application by zone
- Document Field Organic Matter by zone
- Document Field Notes by zone
- Document Seeding Date by zone
- Set Custom Rainfall Down Limits
- Document Field history by zone (crop, yield, yield factors)
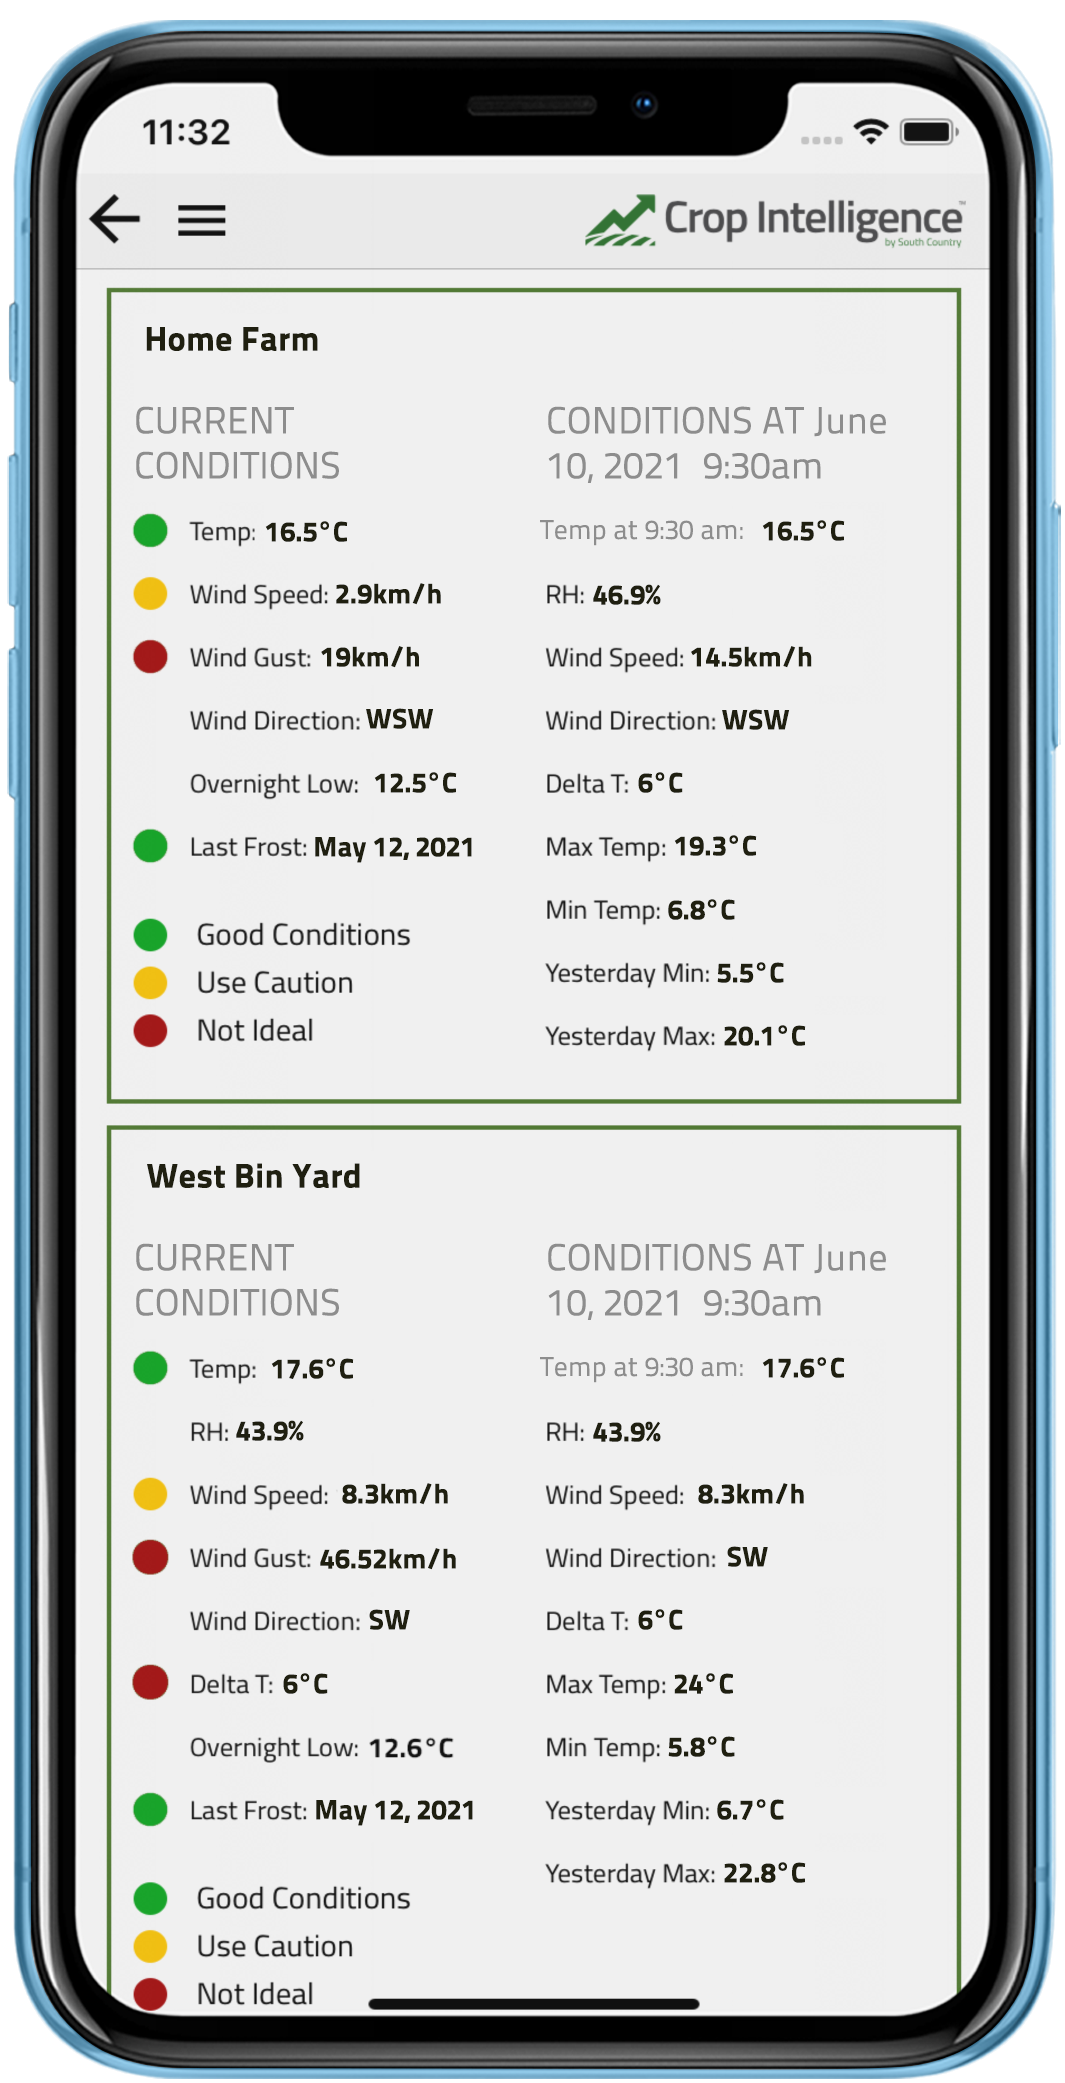
- Spray Conditions Tool: At a glance dashboard to factor weather conditions into spraying decisions and a historical log of spray conditions for every day during the growing season.
- Rainfall Scenarios: To easily model future rainfall and the effect it will have on your Water Driven Yield Potential in season.
- Next Year Potential Calculator: Gives insight on Water Driven Yield Potential for different types of crops next year.
