New Features for 2021
Our team has been working hard over the winter to bring you some updated features and functions for the Crop Intelligence app. We’re always striving to bring you better, more accurate, and more usable data that supports your objectives.
For 2021 all Crop Intelligence customers will have access to Farmgate features on their environmental sensors. These features allow you to summarize and query environmental sensor data for maximum insights to support farm logistics and agronomic decision making.
Let’s have a look!
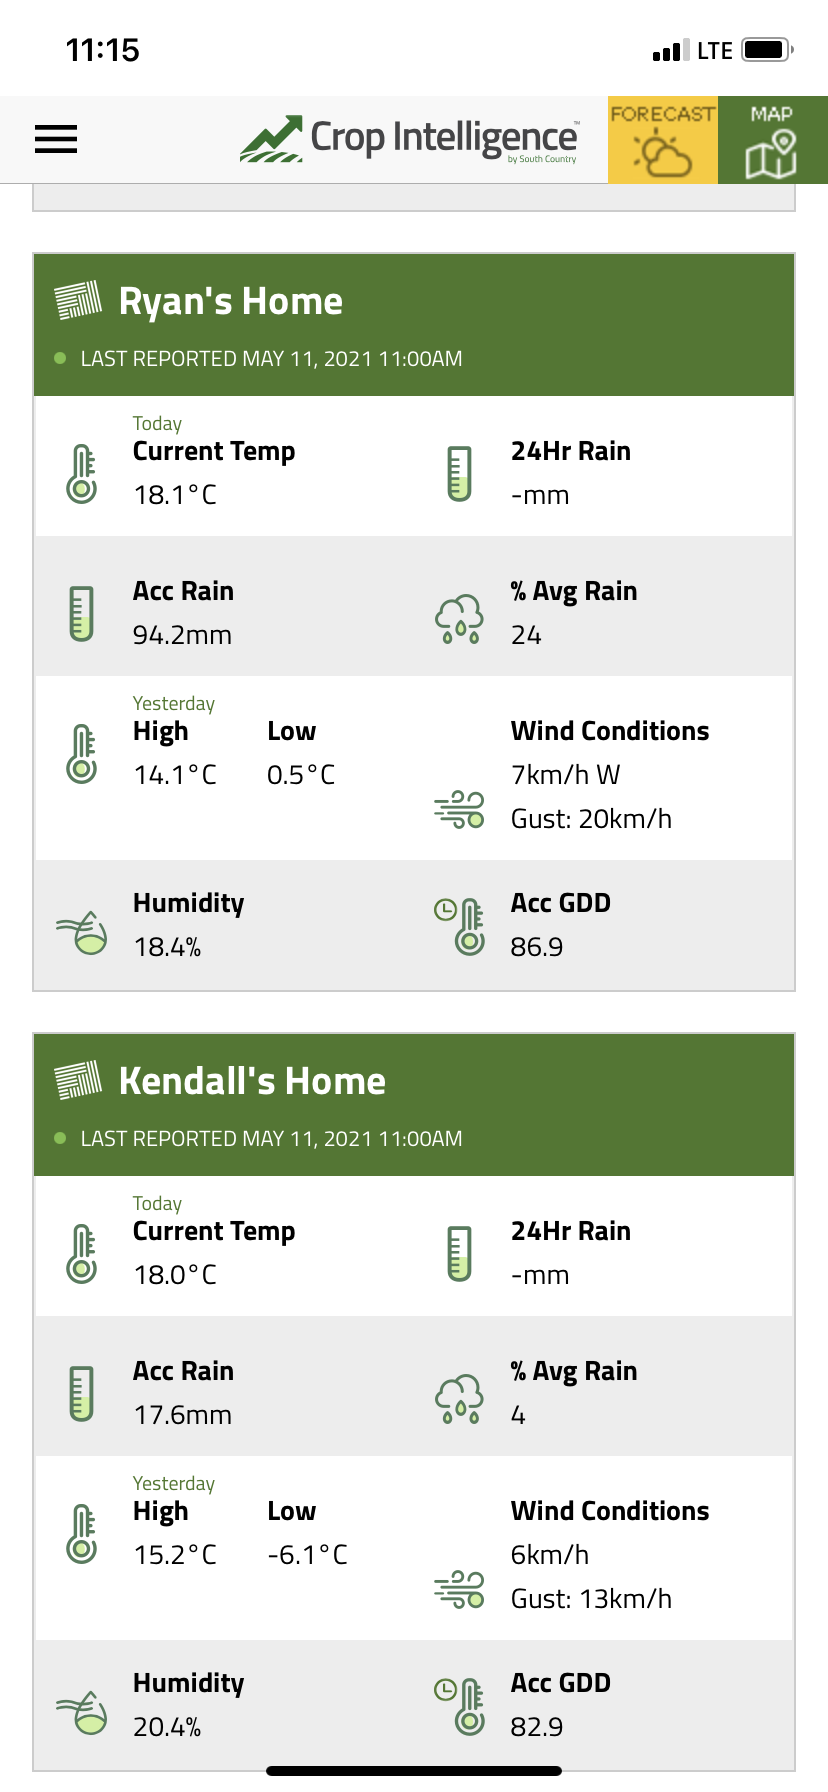
Tile View
Tile view offers you a summary of current conditions on all your stations accumulated rain and growing degree day totals (from install date to current date), and 30-year comparisons of rain and growing degree days.
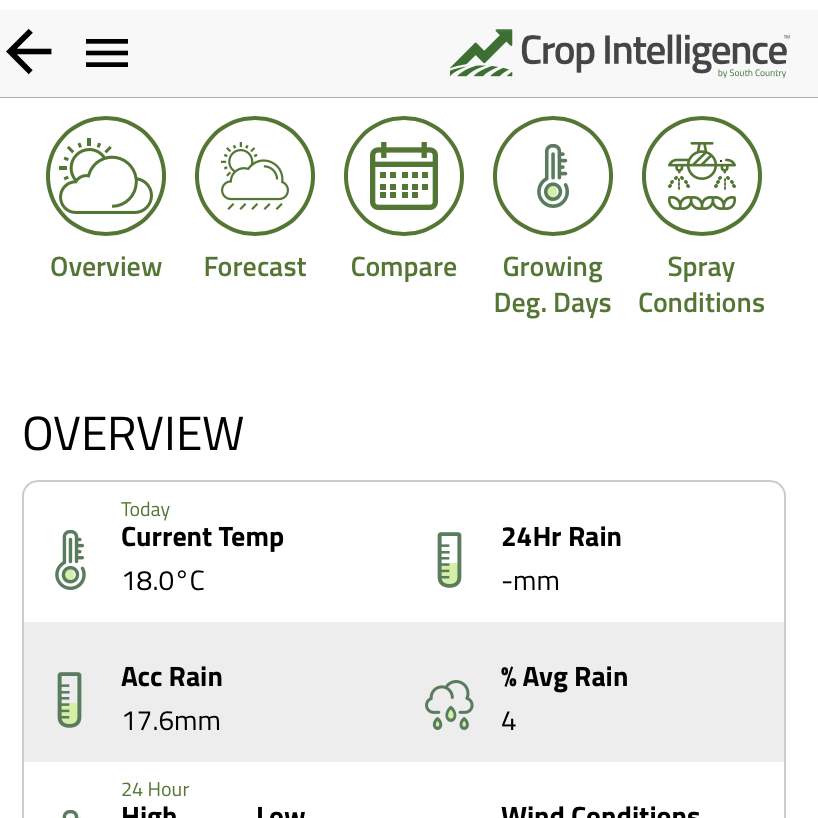
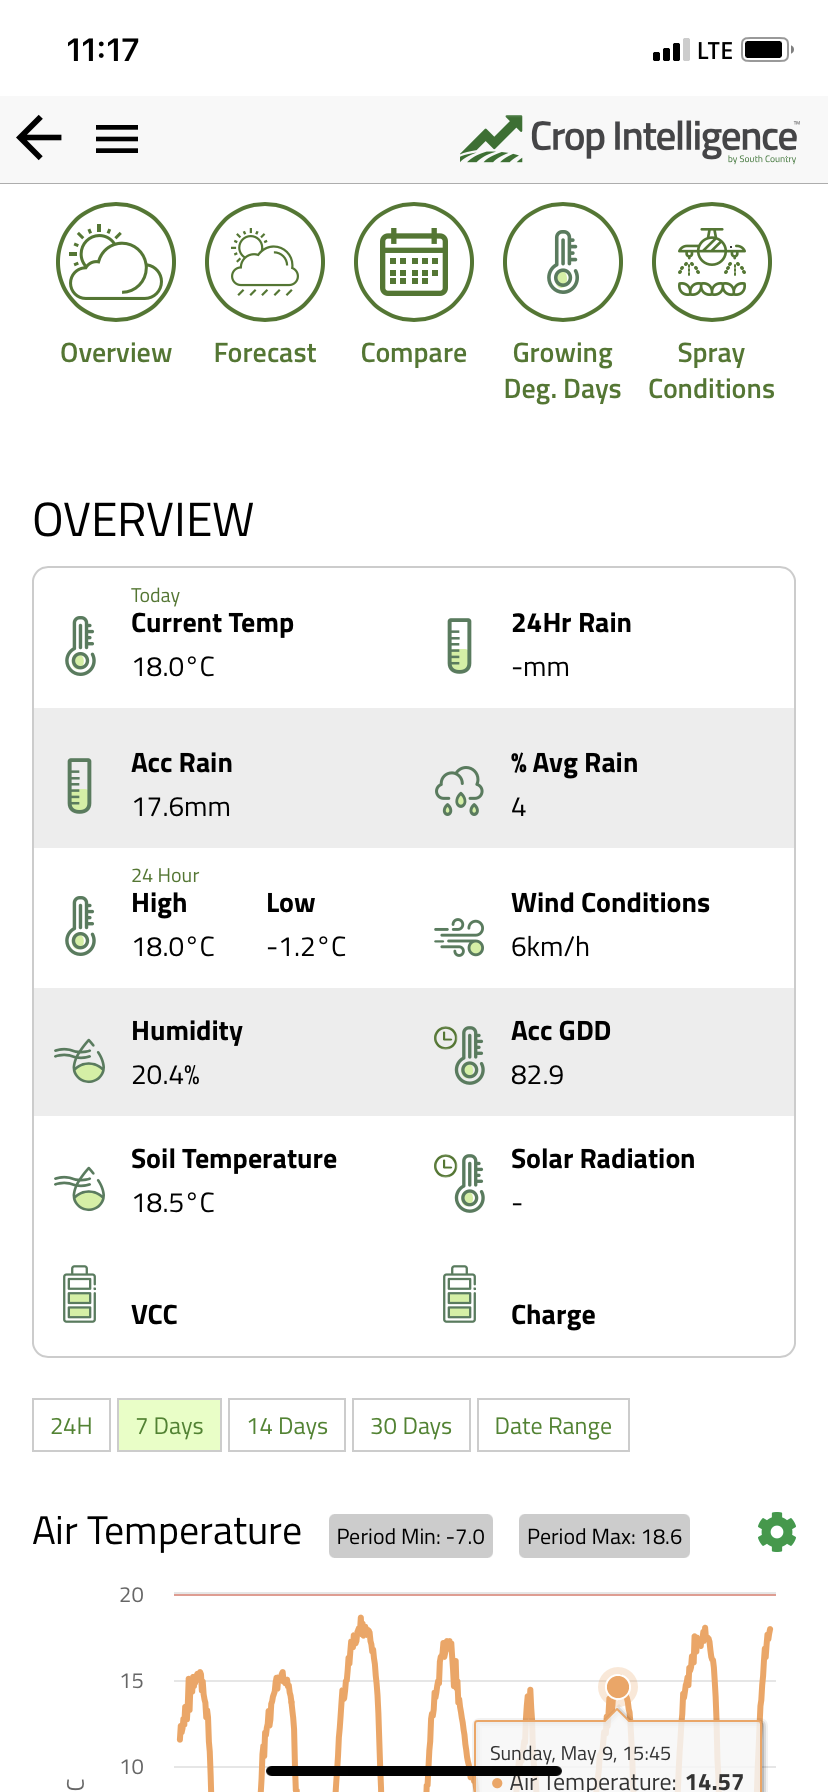
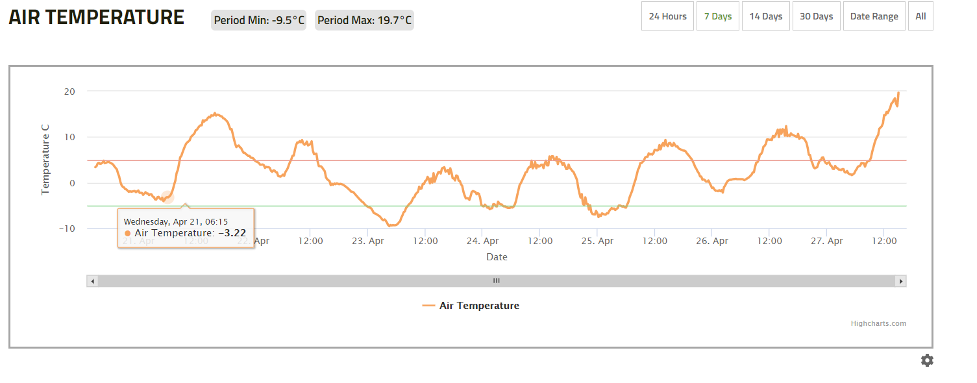
Sensor Overview
Here is the detailed environmental sensor view. You have the option to view the last 24 hours, 7 days, 14 days, 30 days, or a custom date range in this view and you’ll get a summary of each sensor during that time frame (minimums and maximums). More sensors are included in the graphs.
Budget Lines
There are customizable budget lines for all sensor graphs. The budget lines save to the device and station so you can optimize for different crops or regions.
Wind Speed
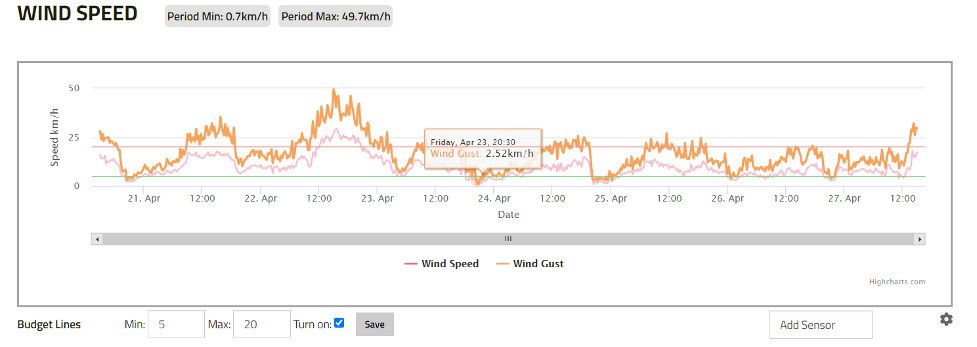
Now wind speed, wind gust and direction are all graphed together. VPD, Delta T and Solar Radiation are now graphed as well, if you have applicable sensors.
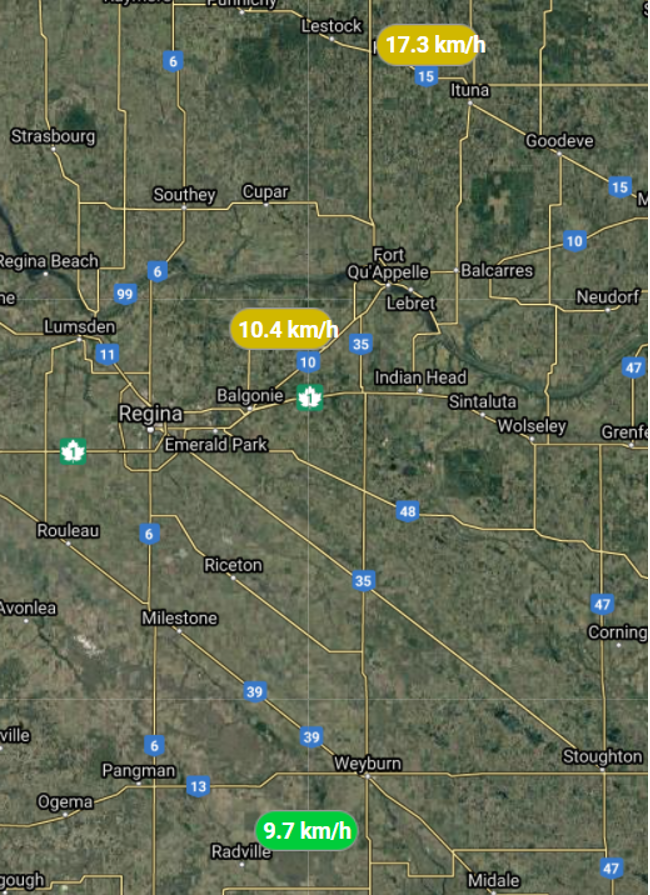
Map View
You now have the option to view sensor details on a map. This can be current data or from a specific date in the past for comparison.
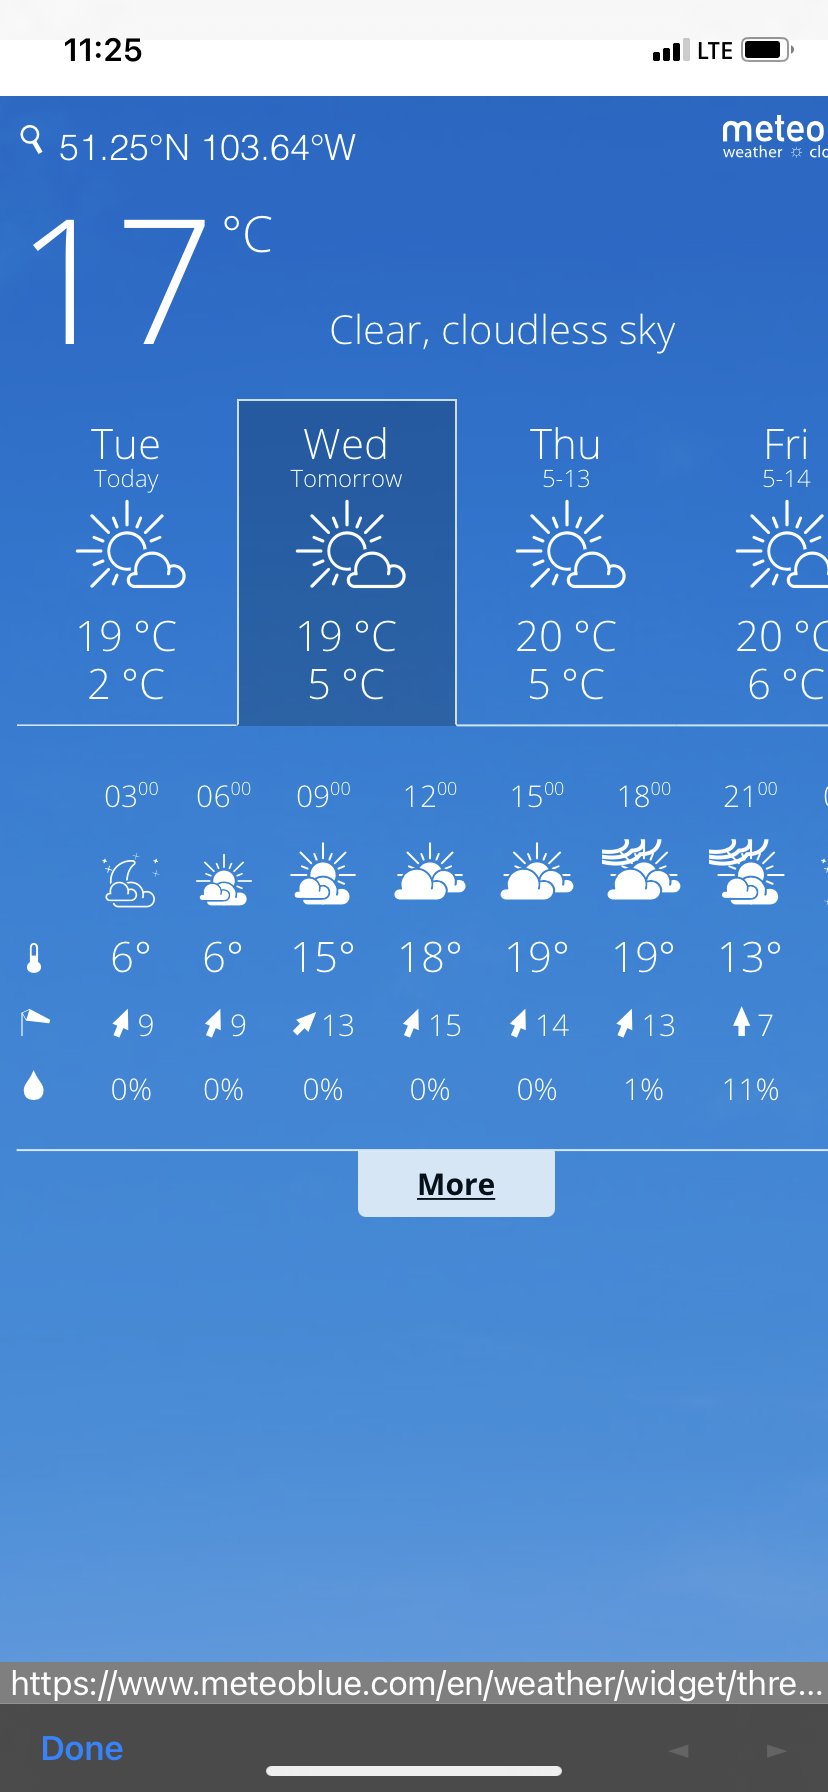
Forecast
We now have an embedded forecast from Meteo Blue. This utilizes the lat/long of the station to pull a local forecast and changes depending on which station you are viewing. You have the option on the app to set a default location. View a 7-day forecast on desktop and a 4-day forecast on the app.
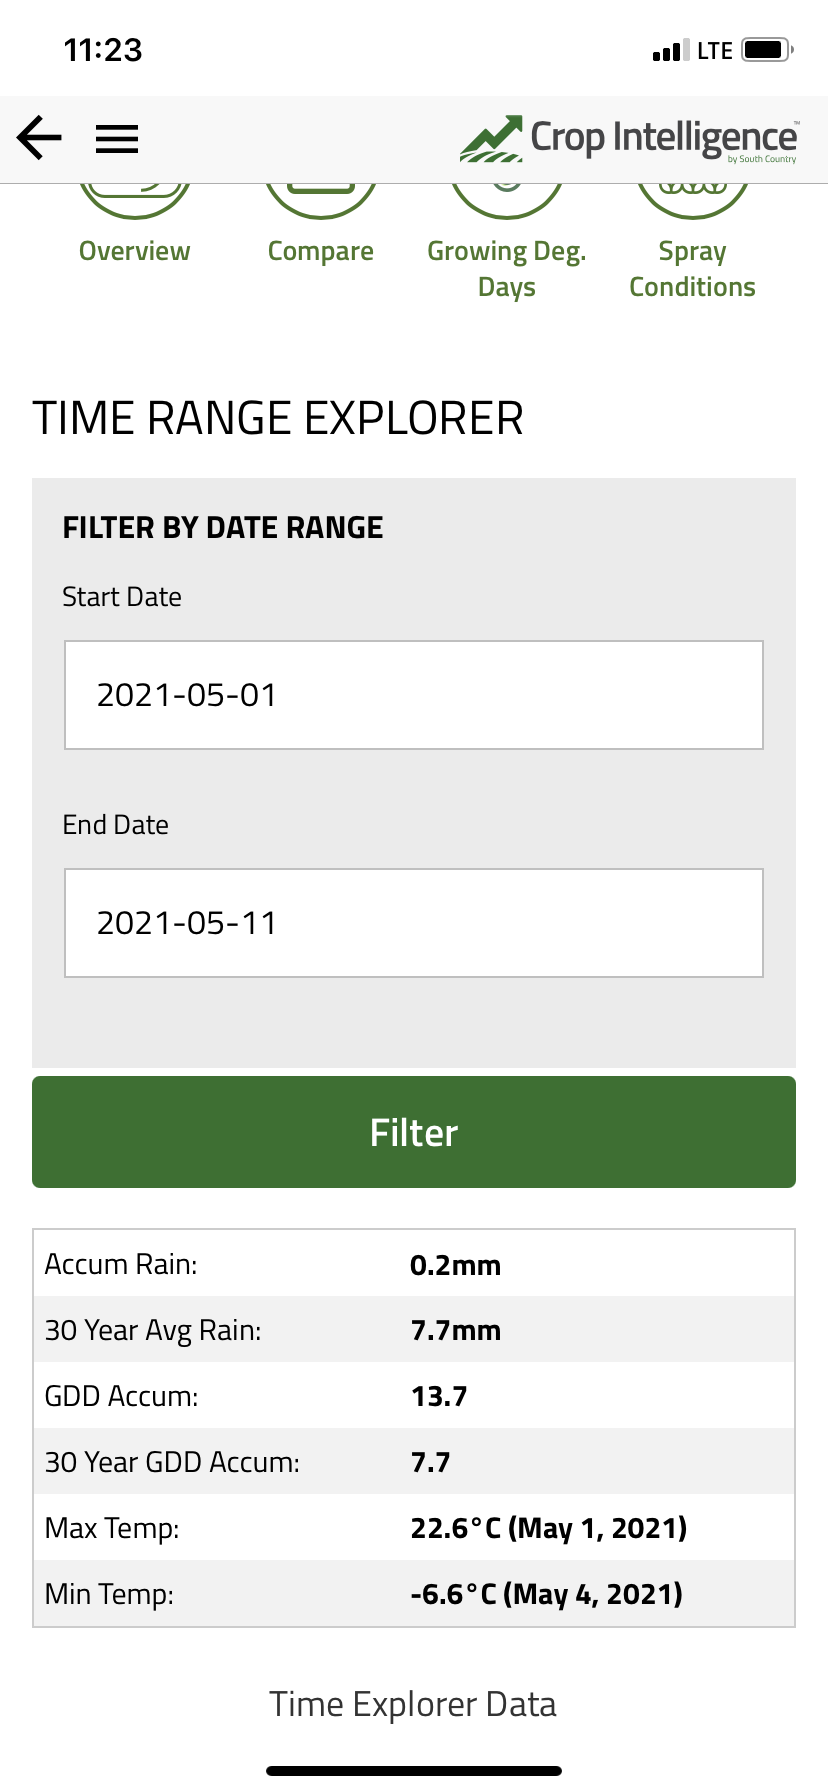
Time Range Explorer
With Time Range Explorer you can now generate summary statistics and graphs for a specific time period.
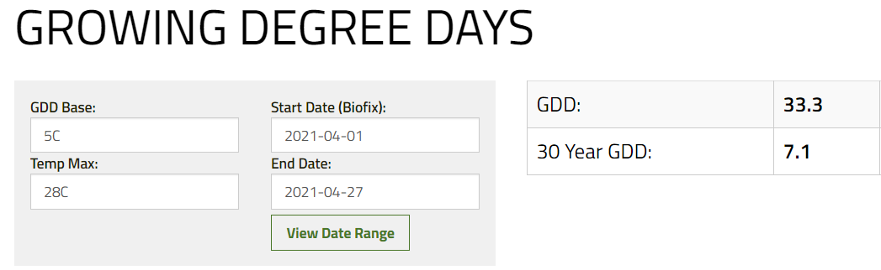
Growing Degree Days
The Growing Degree Day calculator allows you to specify your base and maximum temperature to calculate GDD for a specific time period and compare to average.
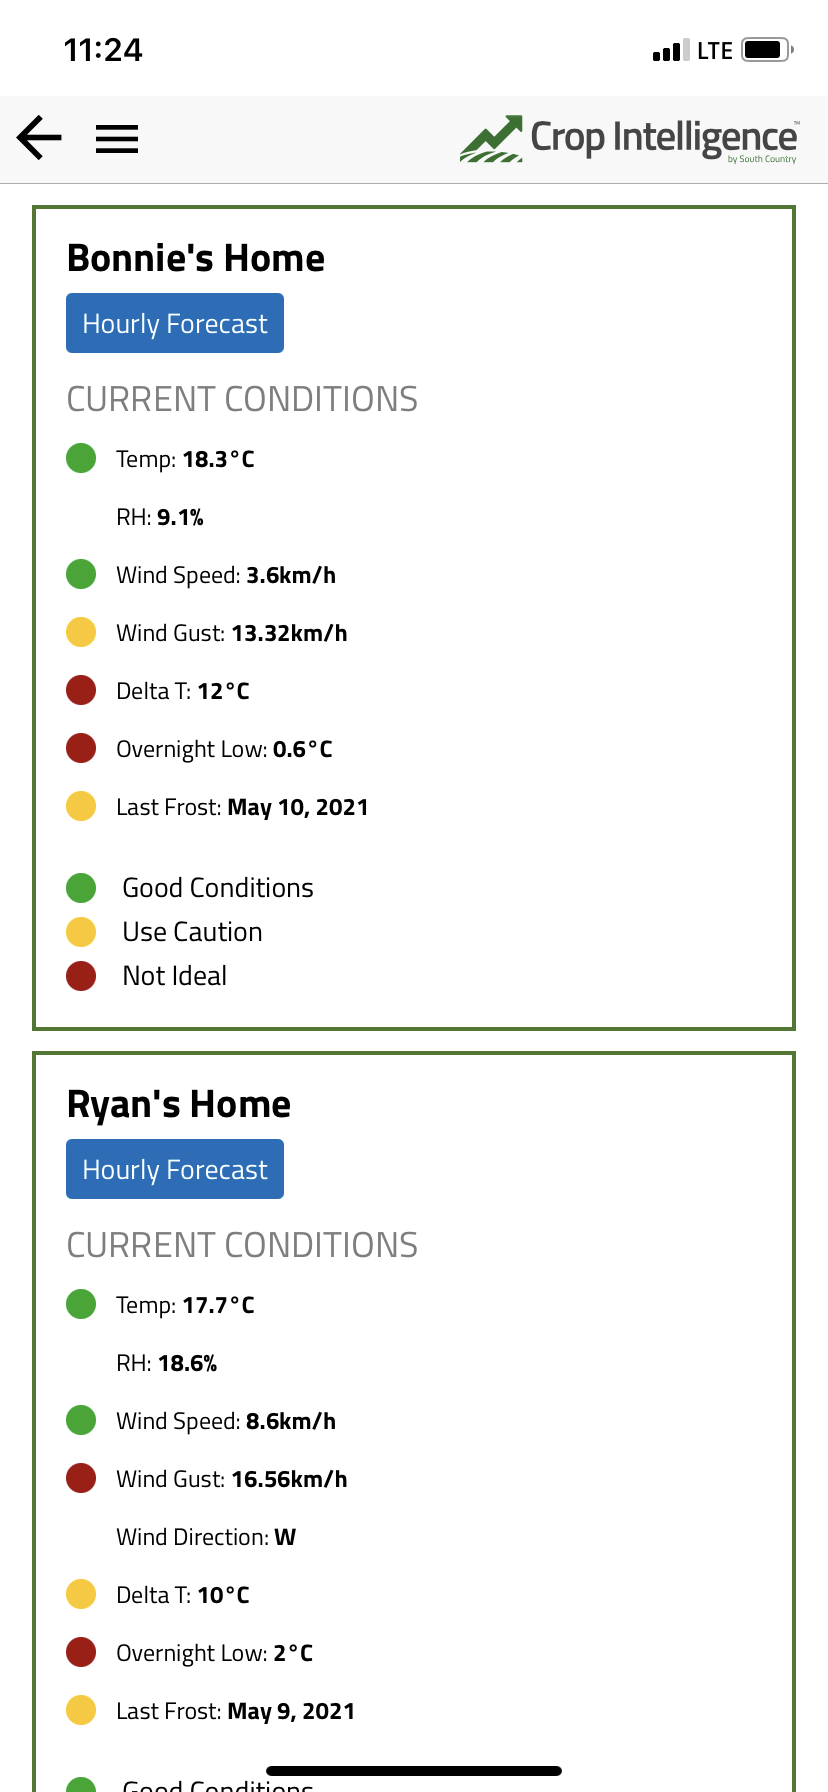
Spray Conditions
Spray conditions provide general indicators for wind speed, temperature, and recent conditions to help you make those vital spraying decisions.