What is your disease risk? How can Crop Intelligence aid in fungicide decsions?
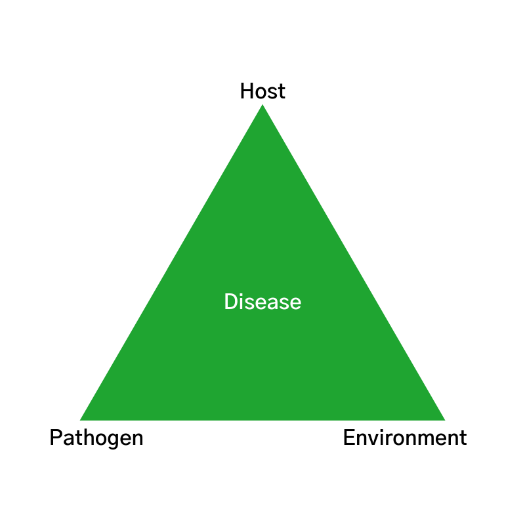
Whether you have a Field Connect or a Pessl weather station, basic weather data or a station with all the sensors, your weather station and Crop Intelligence can provide valuable information to aid in the fungicide decision-making process. Consider that all fungicide decisions need to be made in context of the disease triangle. There are many risk factors that are not captured in weather station data or in Crop Intelligence, including; crop condition and stage, varietal susceptibility, and field history.
- Soil moisture data – moist soil at the 10 cm sensor depth will increase disease risk.
- Water Driven Yield Potential (WDYP) – in context with field conditions, WDYP can assist in determining whether there is yield potential in your field worth protecting and assist in the cost-benefit analysis of the added expense of a fungicide application.
- Rain Events: rain (sometimes as little as 2 mm) is often required to trigger the disease cycle. An accurate record of rain events is essential when assessing disease risk.
- Environmental Data: additional environmental sensors can help determine if pathogen specific conditions are optimal for crop infection.
- Air temperature
- Relative Humidity
- Leaf Wetness
Environmental Conditions for Sclerotinia Infection of Canola:
- Apothecia germinate when soil temperatures are 10-25ºC and the soil is moist.
- Apothecia can survive for approximately 20 days at 15-20ºC, but will die much more quickly when temperatures are above 25ºC.
- Plant infection is favorable when Relative Humidity is above 80% and air temperatures are 21-26ºC.
- Once plant infection has occurred, disease progress is favored by mild temperatures (15-20ºC) and moist conditions in dense crop canopy.
Environmental Conditions for Fusarium Head Blight of Cereals:
- Rain splash (from rain events as small as 2 mm) initiates the infection process.
- Long periods of high relative humidity (>80%).
- Warm temperatures (24-30ºC).
- The highest rates of infection occur when there are prolonged or repeated periods of wetness and high humidity during flowering (or head emergence in barley).
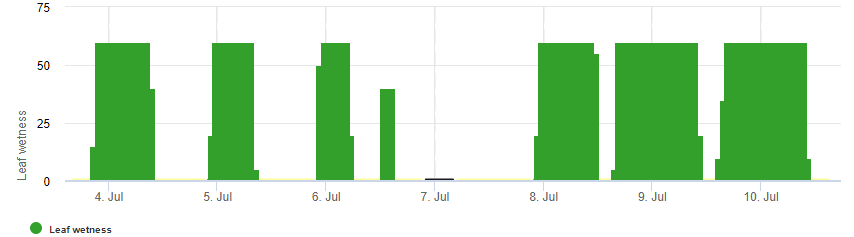
Interpreting Pessl Leaf Wetness Sensor:
Hourly Data: leaf wetness values are shown as the number of minutes per hour that the leaf wetness sensor registered as wet.
- Leaf Wetness: 0 = sensor was dry for the full hour.
- Leaf Wetness: 30 = sensor was wet for 30 minutes of the hour.
- Leaf Wetness: 60 = sensor was wet for 60 minutes of the hour.
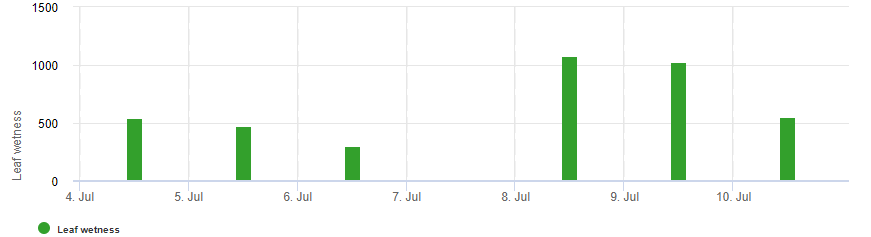
Daily Data: leaf wetness values are shown as the number of minutes per day that the leaf wetness sensor registered as wet out of 1440 total minutes in a day (24 hours x 60 minutes).
- Leaf Wetness: 0 min = sensor was dry the entire day.
- Leaf Wetness: 720 min = sensor was wet for 720 minutes (12 hours) of the day.
- Leaf Wetness: 1440 min = sensor was wet for 1440 minutes (24 hours) of the day.
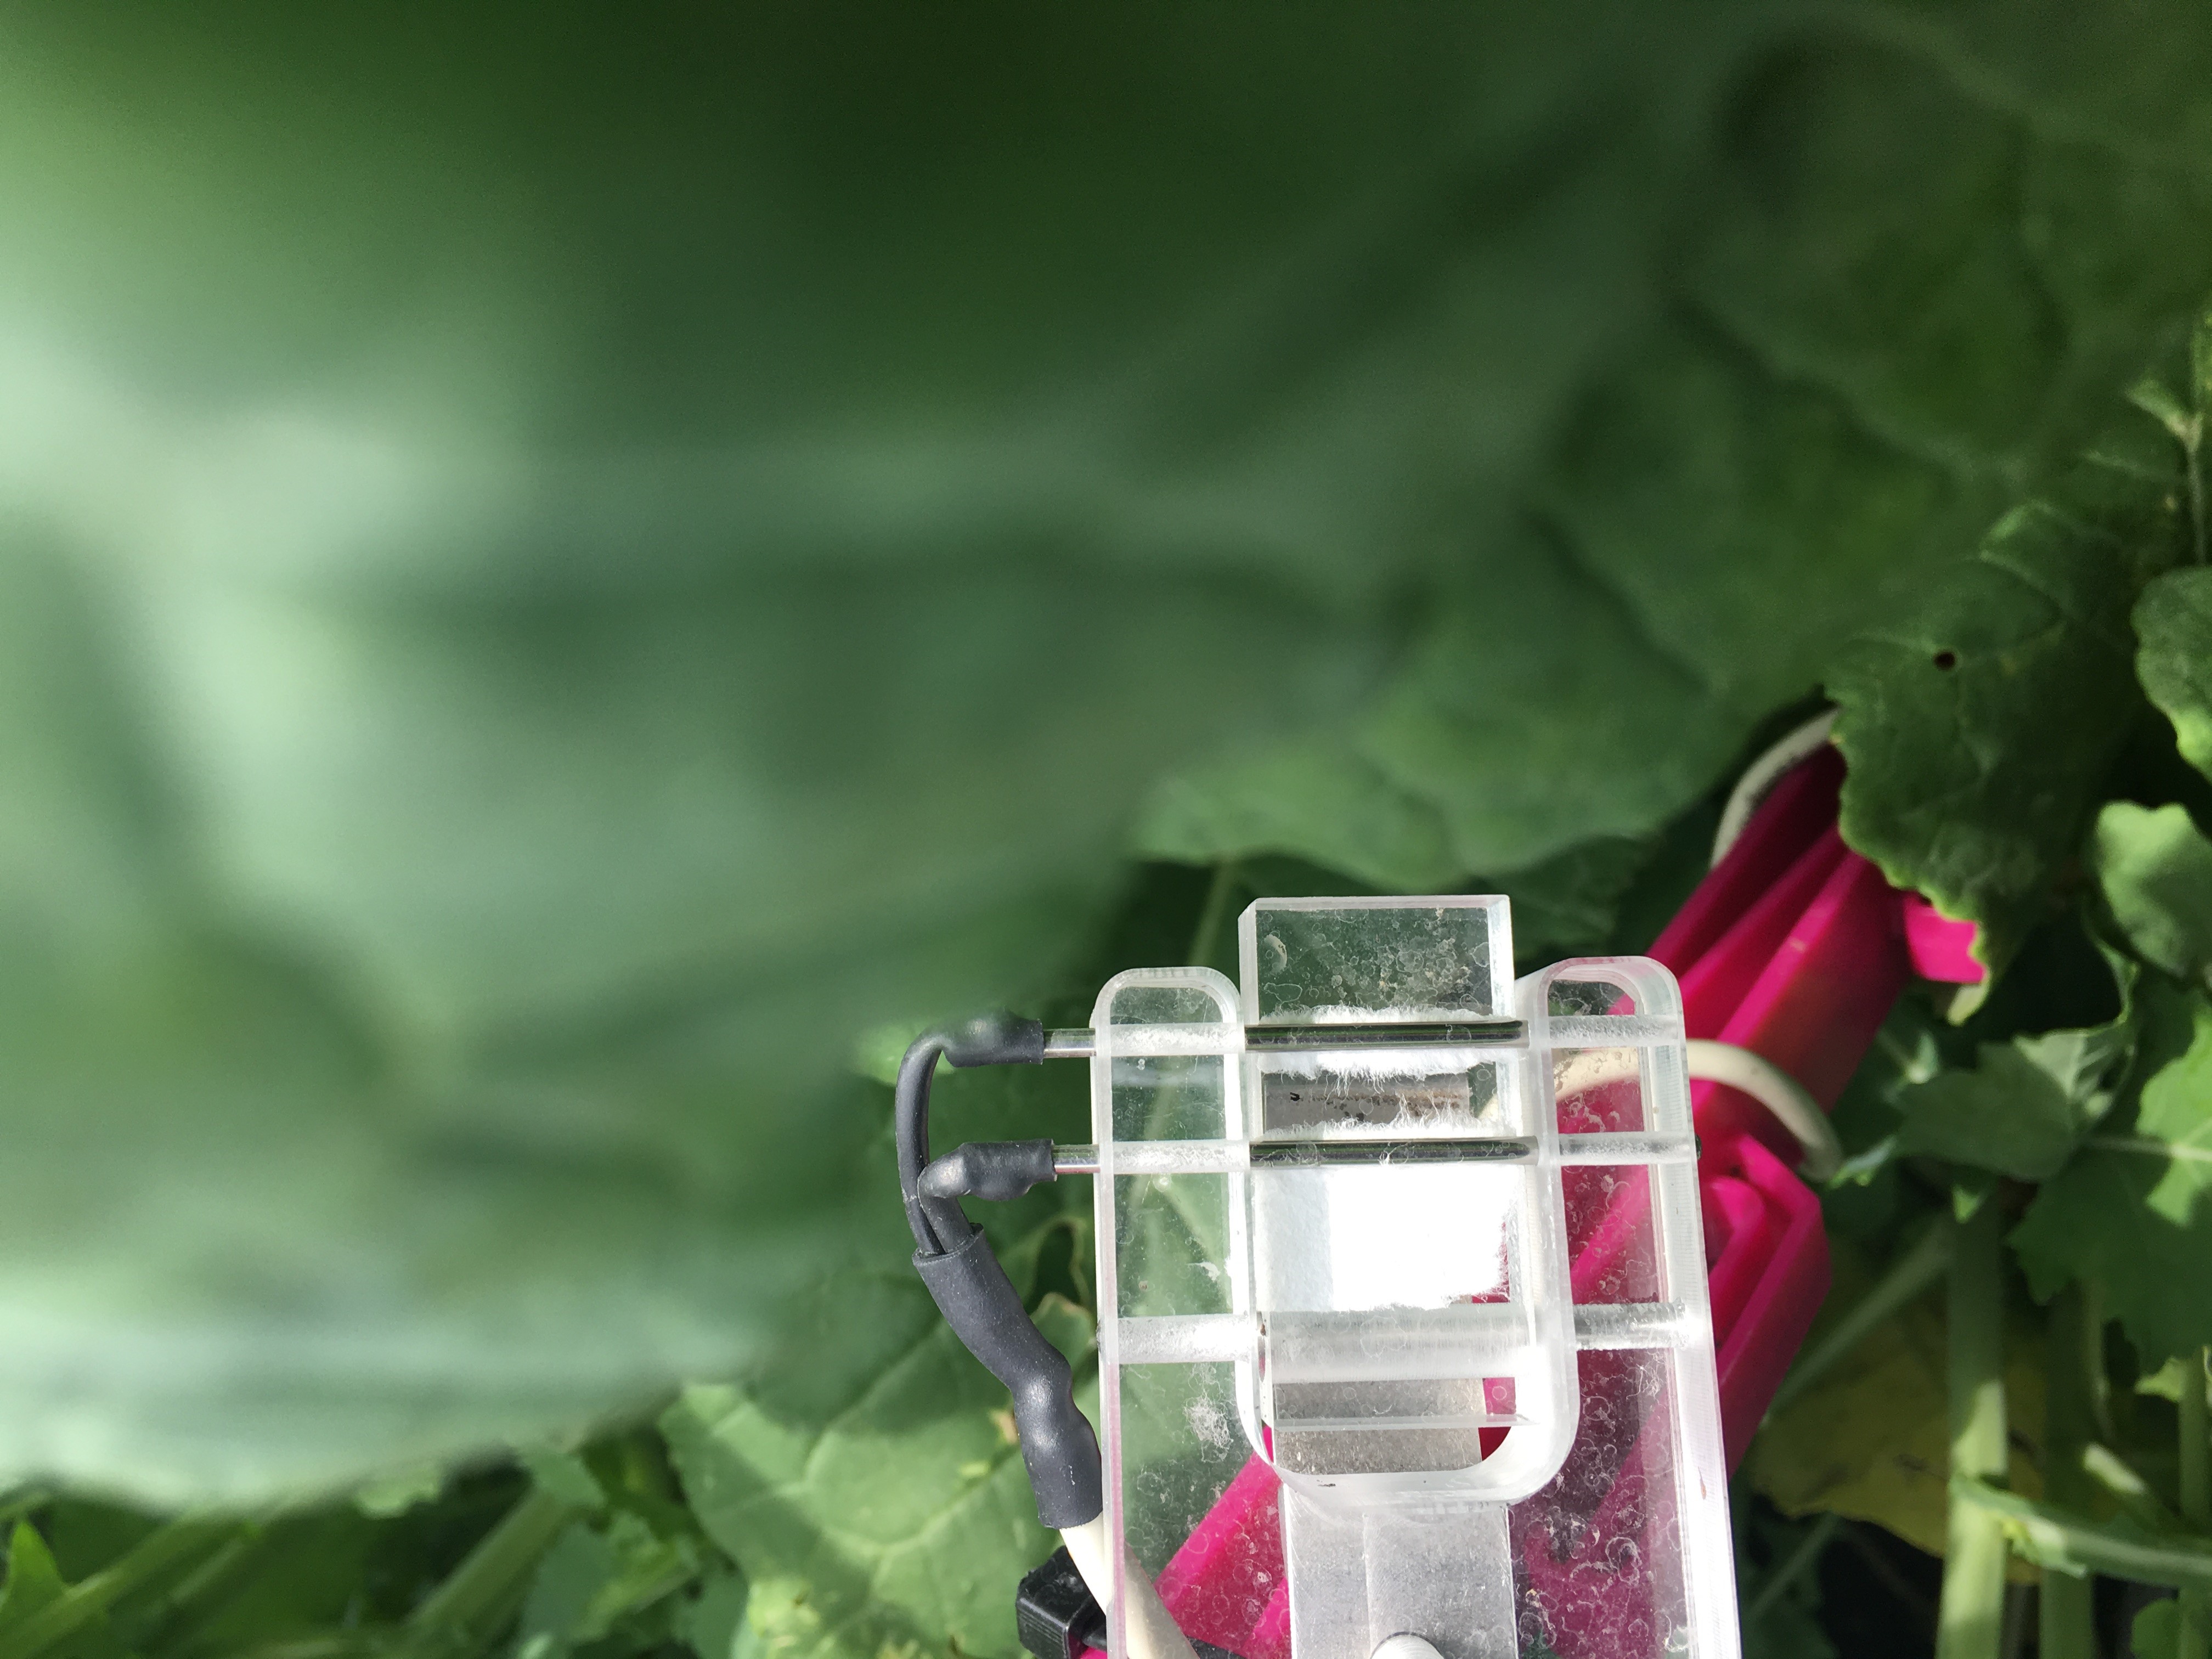
The Pessl leaf wetness sensors require the filter paper on the sensor to be intact in order to register leaf wetness. If you are constantly seeing leaf wetness values of 0, even during rain events, it may be worthwhile to check the sensor and replace the filter paper if required.
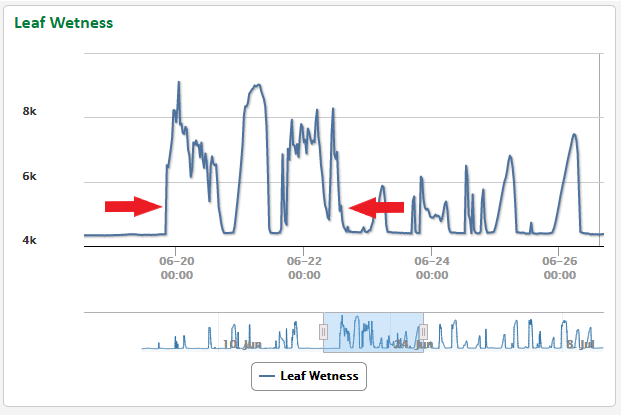
Field Connect Leaf Wetness Sensor:
- When the sensor is reading 4200 or lower, it is dry. Once the sensor is reading 5000-5400 there is moisture within the crop canopy.
- Rain is the most consistent predictor of extended periods of leaf wetness